
2023 confirmed hottest year on record, global temperature close to 1.5 C limit
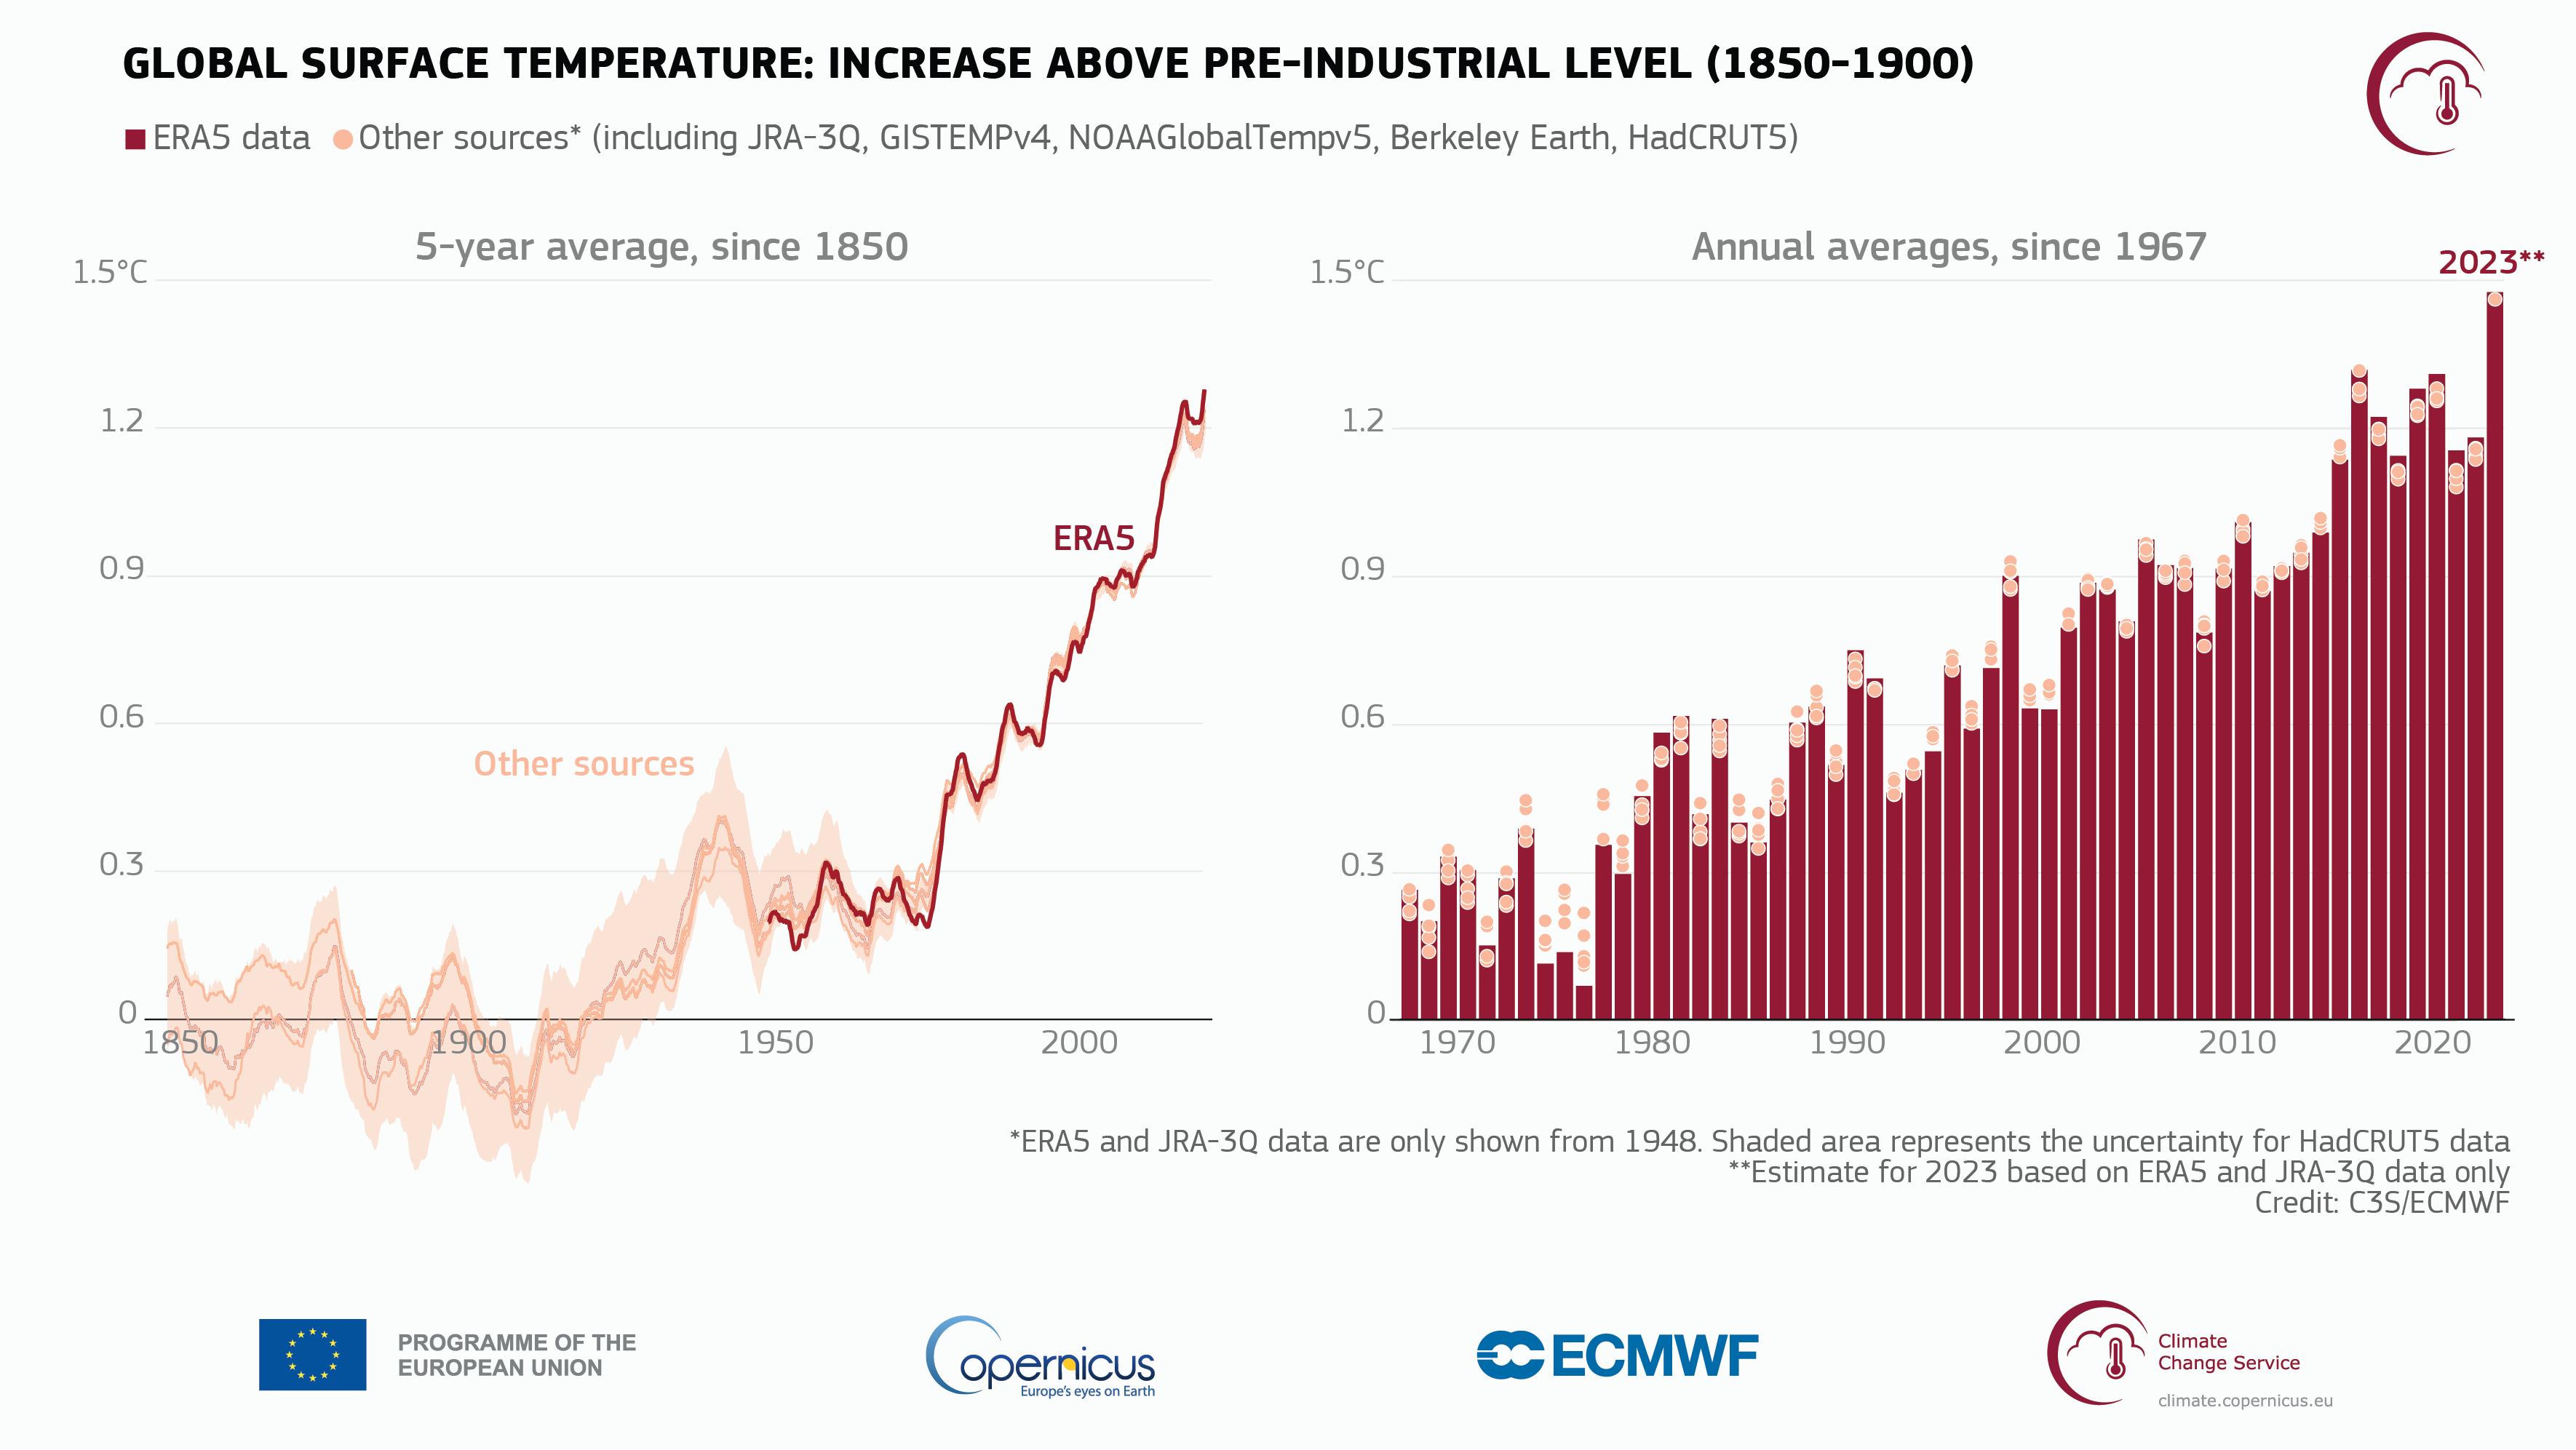
Global surface air temperature increase relative to the average for 1850-1900, the designated pre-industrial reference period, based on several global temperature datasets shown as 5-year averages since 1850 (left) and as annual averages since 1967 (right). C3S/Graph
Jan. 9 (ZFJ) — Scientists have confirmed 2023, which saw multiple record-breaking conditions, as the hottest year on record.
The year was characterized by many extreme weather events occurring globally, including heat waves, floods, droughts, and wildfires.
The Copernicus Climate Change Service (C3S), part of the European Union’s space program, reported the data in its Global Climate Highlights 2023 report, which is based mainly on its ERA5 reanalysis dataset, which goes back to 1940.
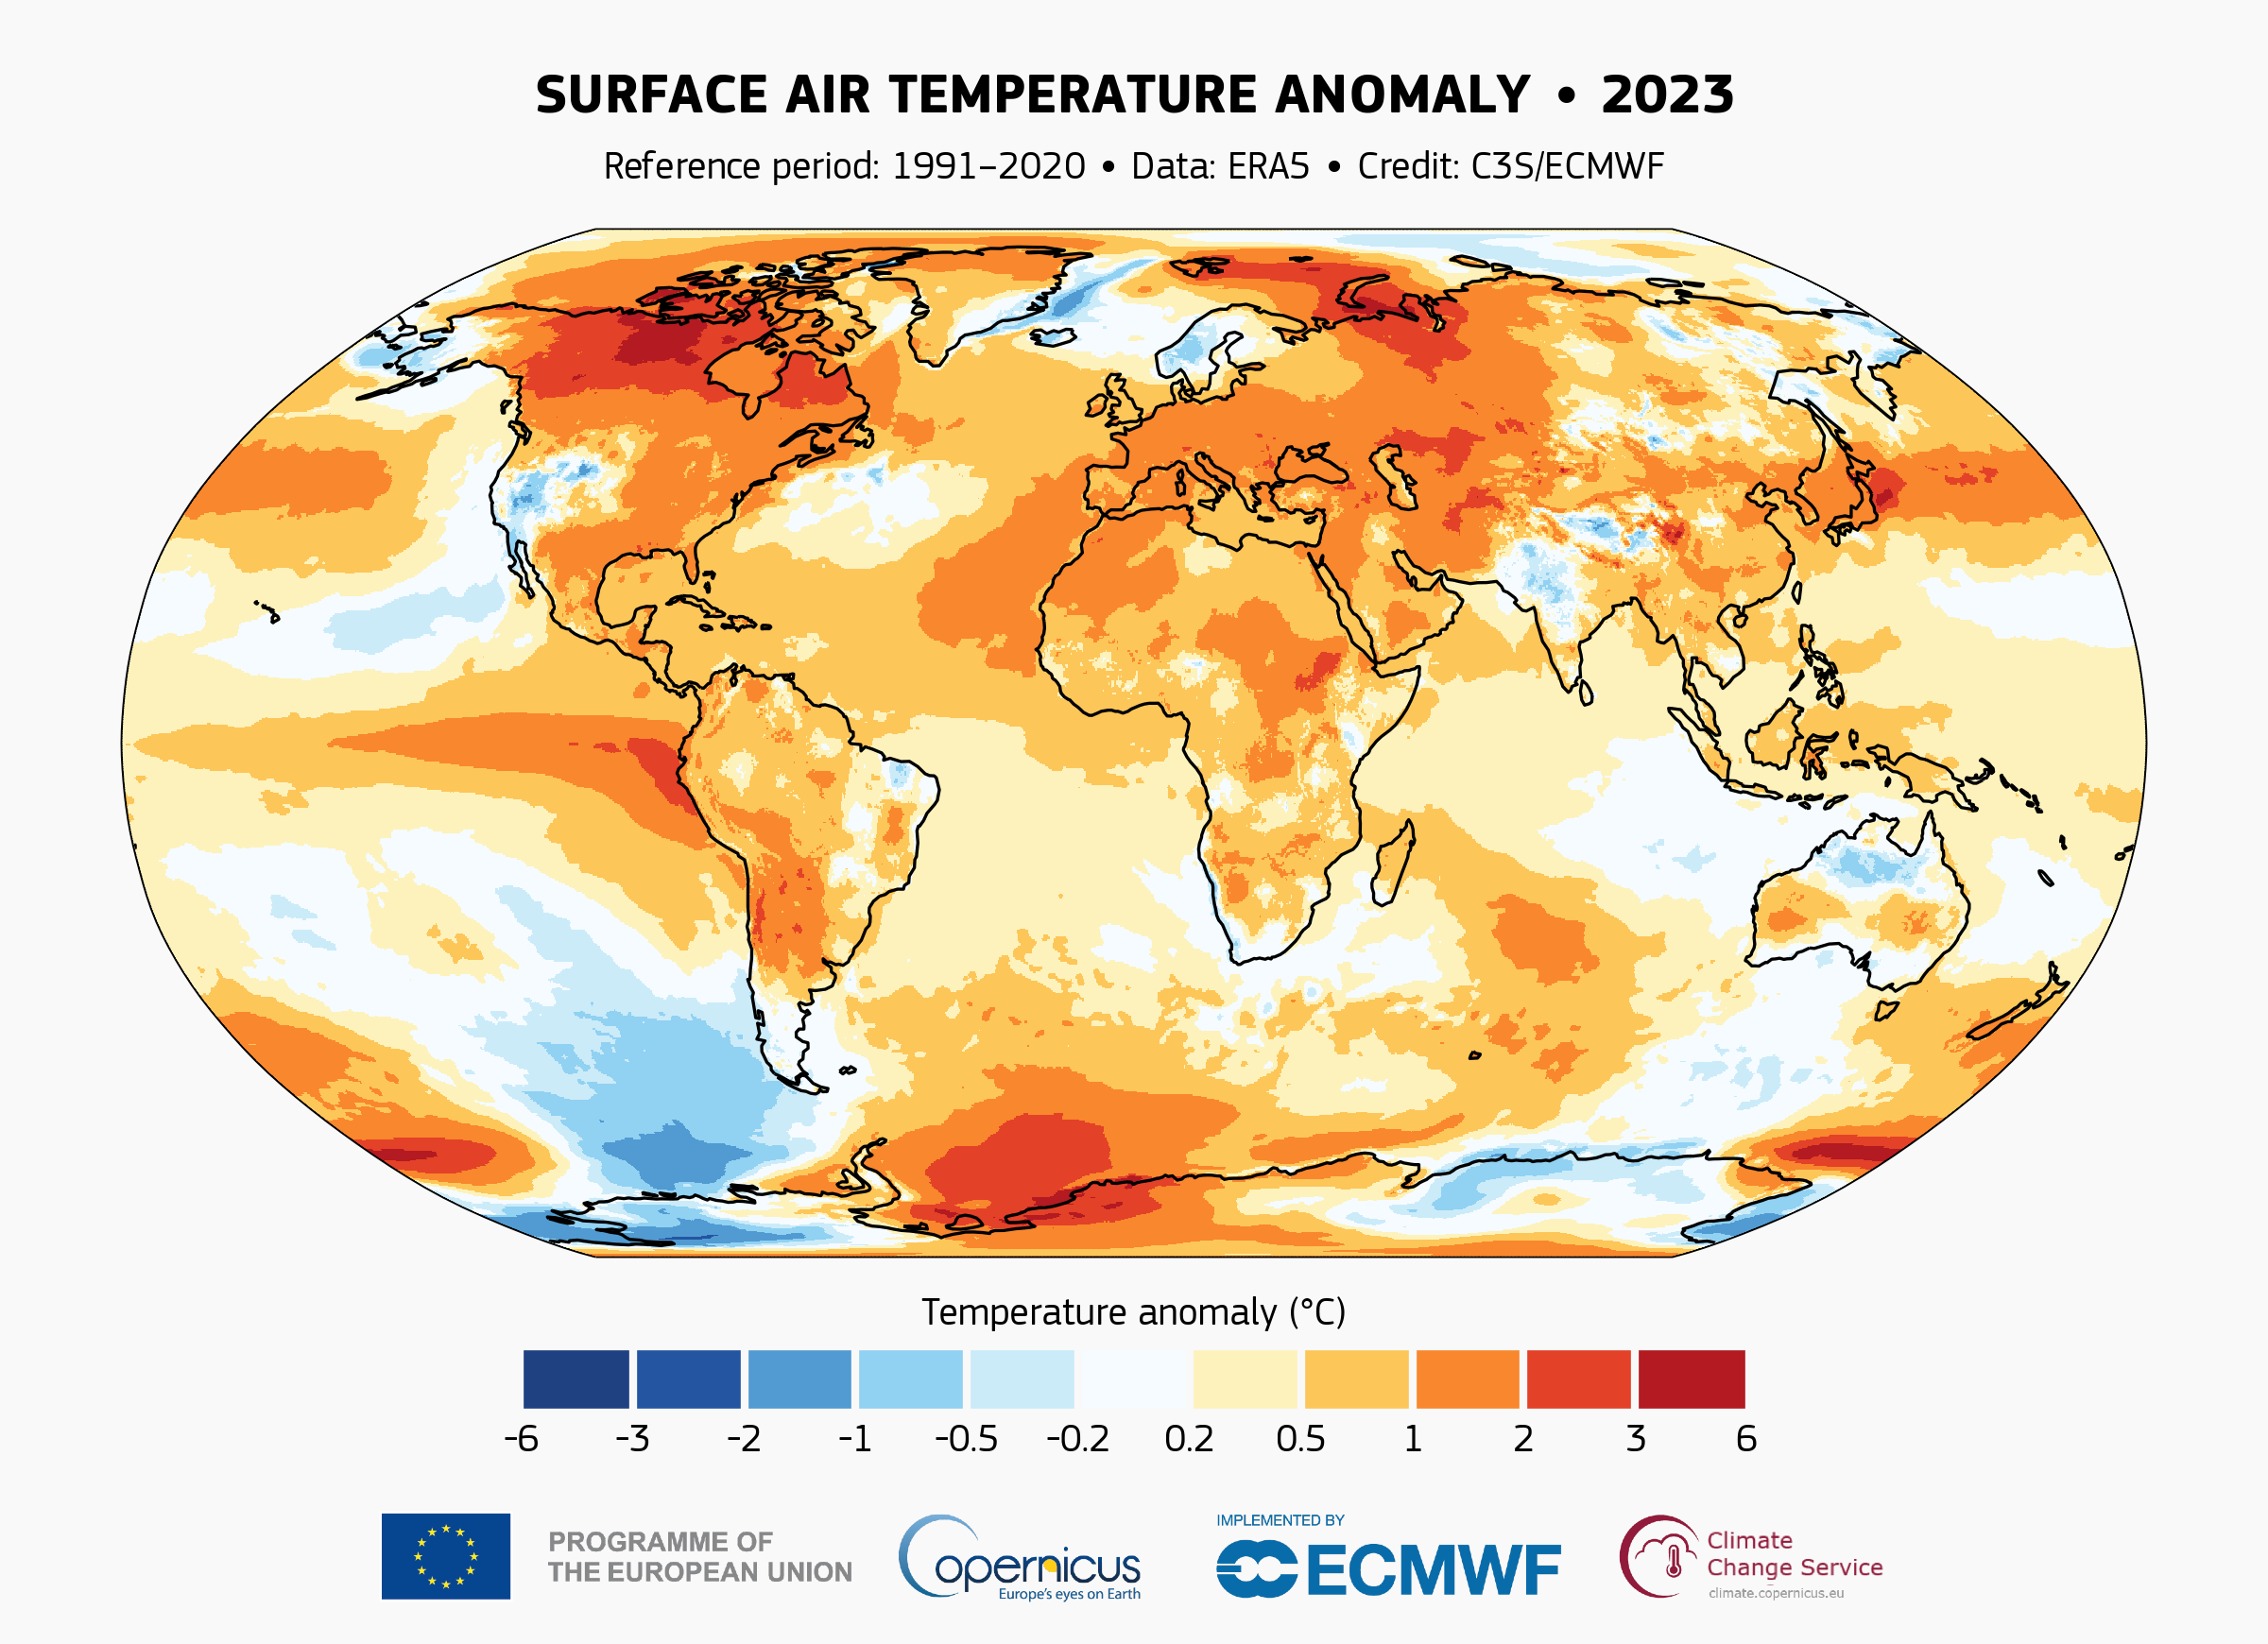 Surface air temperature anomaly for 2023 relative to the average for the 1991-2020 reference period. Data source: ERA5. C3S/Graph
According to C3S, 2023 had a global average surface air temperature of 14.98 degrees Celsius—0.17 C higher than the previous highest annual value in 2016.
It was also 1.48 C warmer than the 1850-1900 pre-industrial level. C3S says that a 12 month period ending in January or February 2024 will exceed the 1.5 C threshold set by the Paris Agreement. For the treaty’s limits to be considered surpassed, the average temperature anomaly would have to be higher than 1.5 C for at least 20 years, although the current situation sets a “dire precedent.”
2023 was the first time on record that every day within a year exceeded 1 C above the pre-industrial level. Almost 50% of days were over 1.5 C above the level, and two days in November were, for the first time, 2 C above.
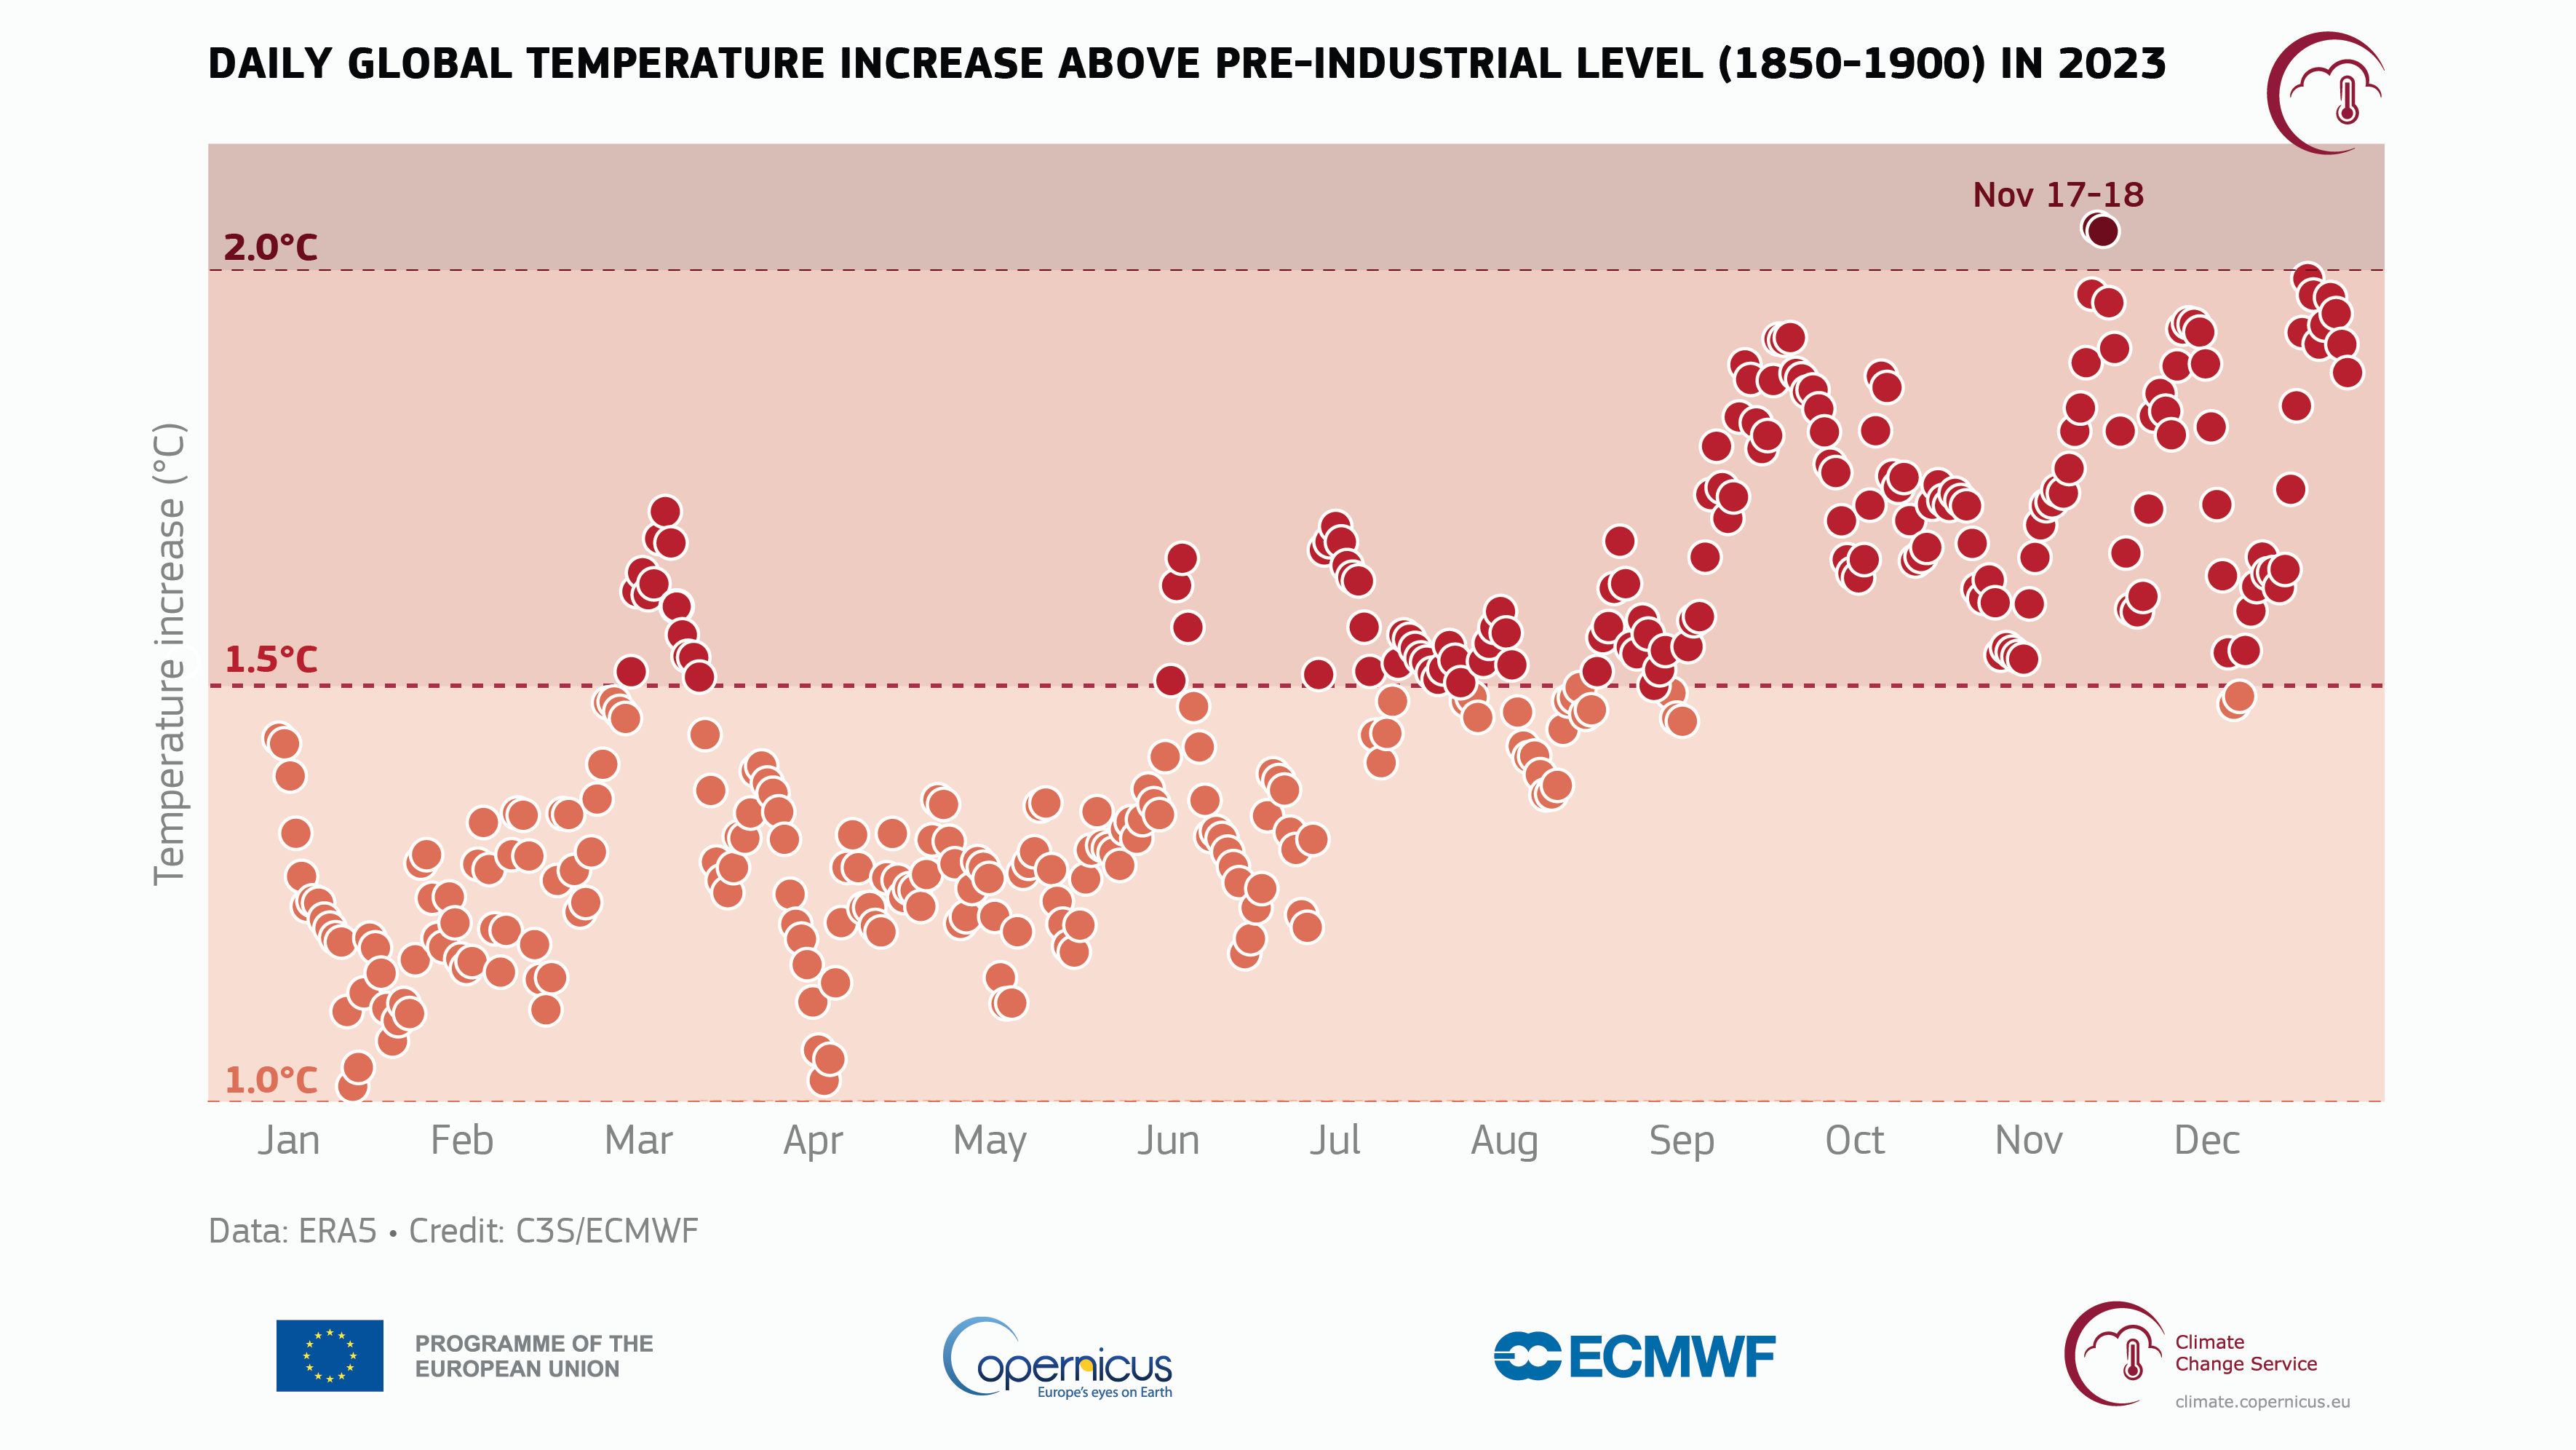 Daily global surface air temperature increase relative to the average for 1850–1900, the designated pre-industrial reference period, for 2023. The plot highlights temperature increases within three ranges: 1–1.5°C (orange), 1.5–2°C (red), and above 2°C (crimson). Source: ERA5. C3S/Graph
Every month from June to December was warmer than the corresponding month in any previous year. July and August were the warmest two months on record, while the summer from June to August was the warmest season on record.
September has the largest temperature deviation above the 1991-2020 average of any month in the ERA5 dataset. December 2023 was the warmest December on record globally—its average temperature was 13.51 C, which is 1.78 C above pre-industrial levels.
Global average sea surface temperatures were persistently and unusually high from April through December, caused by increasing greenhouse gas concentrations as well as El Niño warming event conditions that began in early July.
Antarctic sea ice reached record low extents for the corresponding time of the year in eighth months, with daily and monthly extents reaching all-time minima in February. Arctic sea ice extent, which peaks annually in March, was the fourth lowest for the time of the year in the satellite record.
Atmospheric concentrations of carbon dioxide and methane continued to increase and reached record levels in 2023. Carbon dioxide concentrations reached 419 ppm, 2.4 ppm higher than last year, while methane concentrations reached 1902 ppb, 11 ppb higher than in 2022.
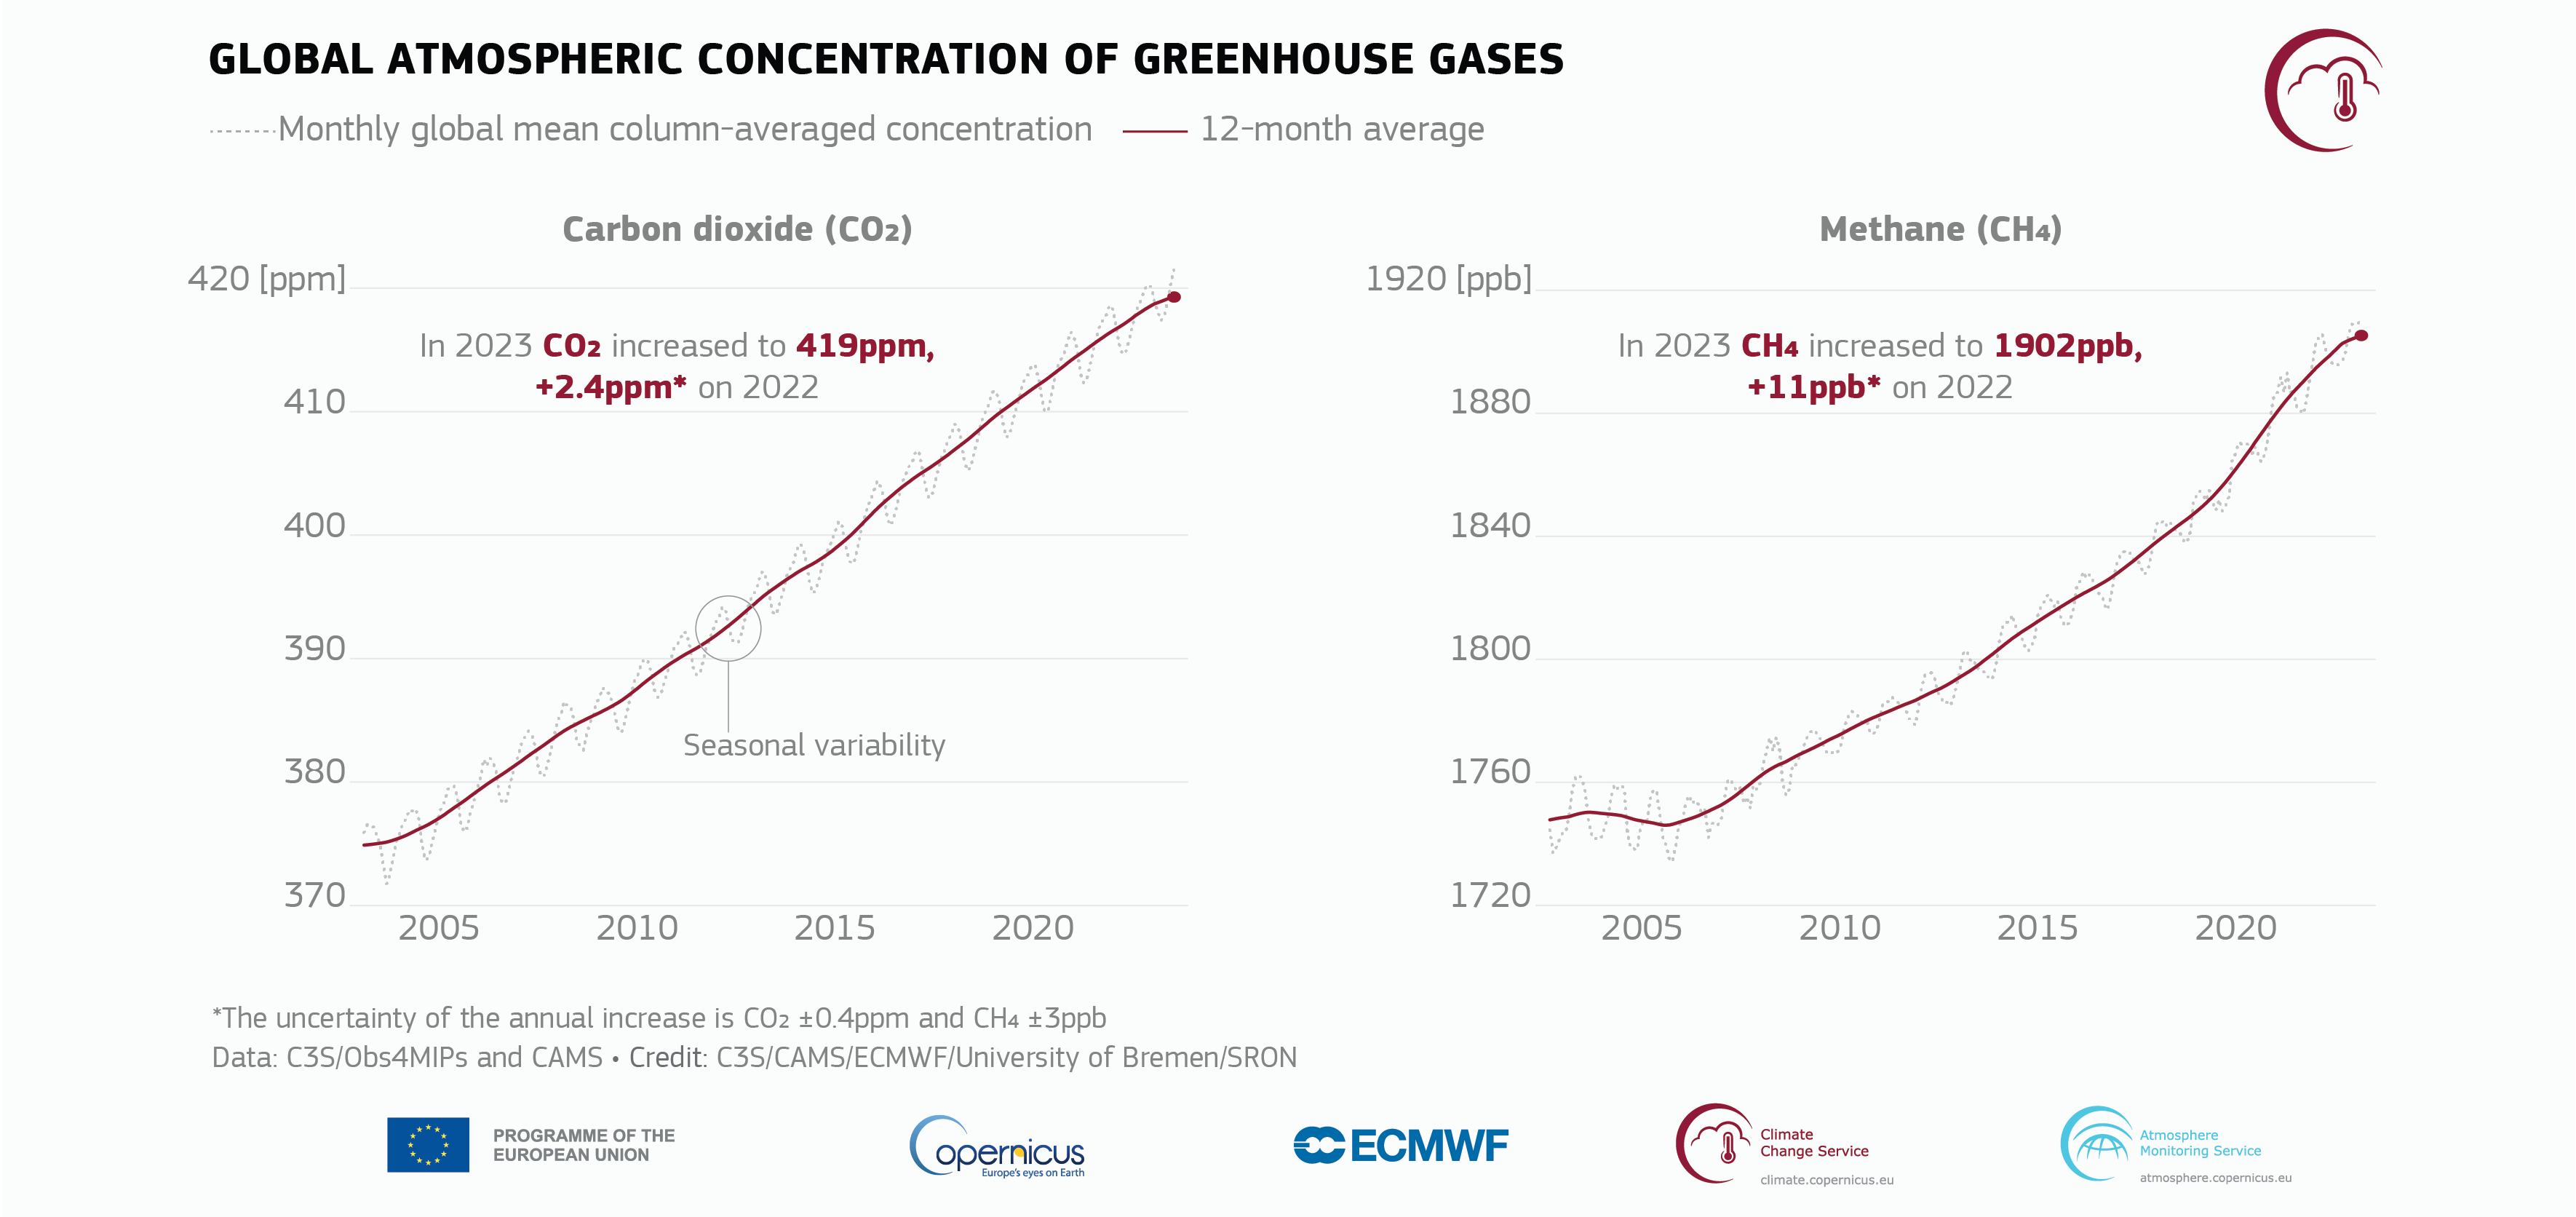 Monthly global mean atmospheric CO2 (left) and CH4 (right) column-averaged concentration from satellites for 2003-2023 (grey curve) and 12-month average (red curve). Data source: C3S/Obs4MIPs (v4.5) consolidated (2003–2022) and CAMS preliminary near real-time data (2023) GOSAT (CH4) and GOSAT-2 (CO2) records. Spatial range: 60S - 60N over land. C3S/Graph
Persistent Canadian wildfires resulted in a 30% increase in estimated global wildfire carbon emissions compared to those of 2022.
“The extremes we have observed over the last few months provide a dramatic testimony of how far we now are from the climate in which our civilisation developed,” said C3S Director Carlo Buontempo. “This has profound consequences for the Paris Agreement and all human endeavours. If we want to successfully manage our climate risk portfolio, we need to urgently decarbonise our economy whilst using climate data and knowledge to prepare for the future.”
References
- Copernicus Climate Change Service - Global Climate Highlights 2023 - https://climate.copernicus.eu/global-climate-highlights-2023 (ARCHIVE)